
Fast. Accurate. Easy to use.
Stata is a powerful and comprehensive software package that offers everything you need to effectively work with data
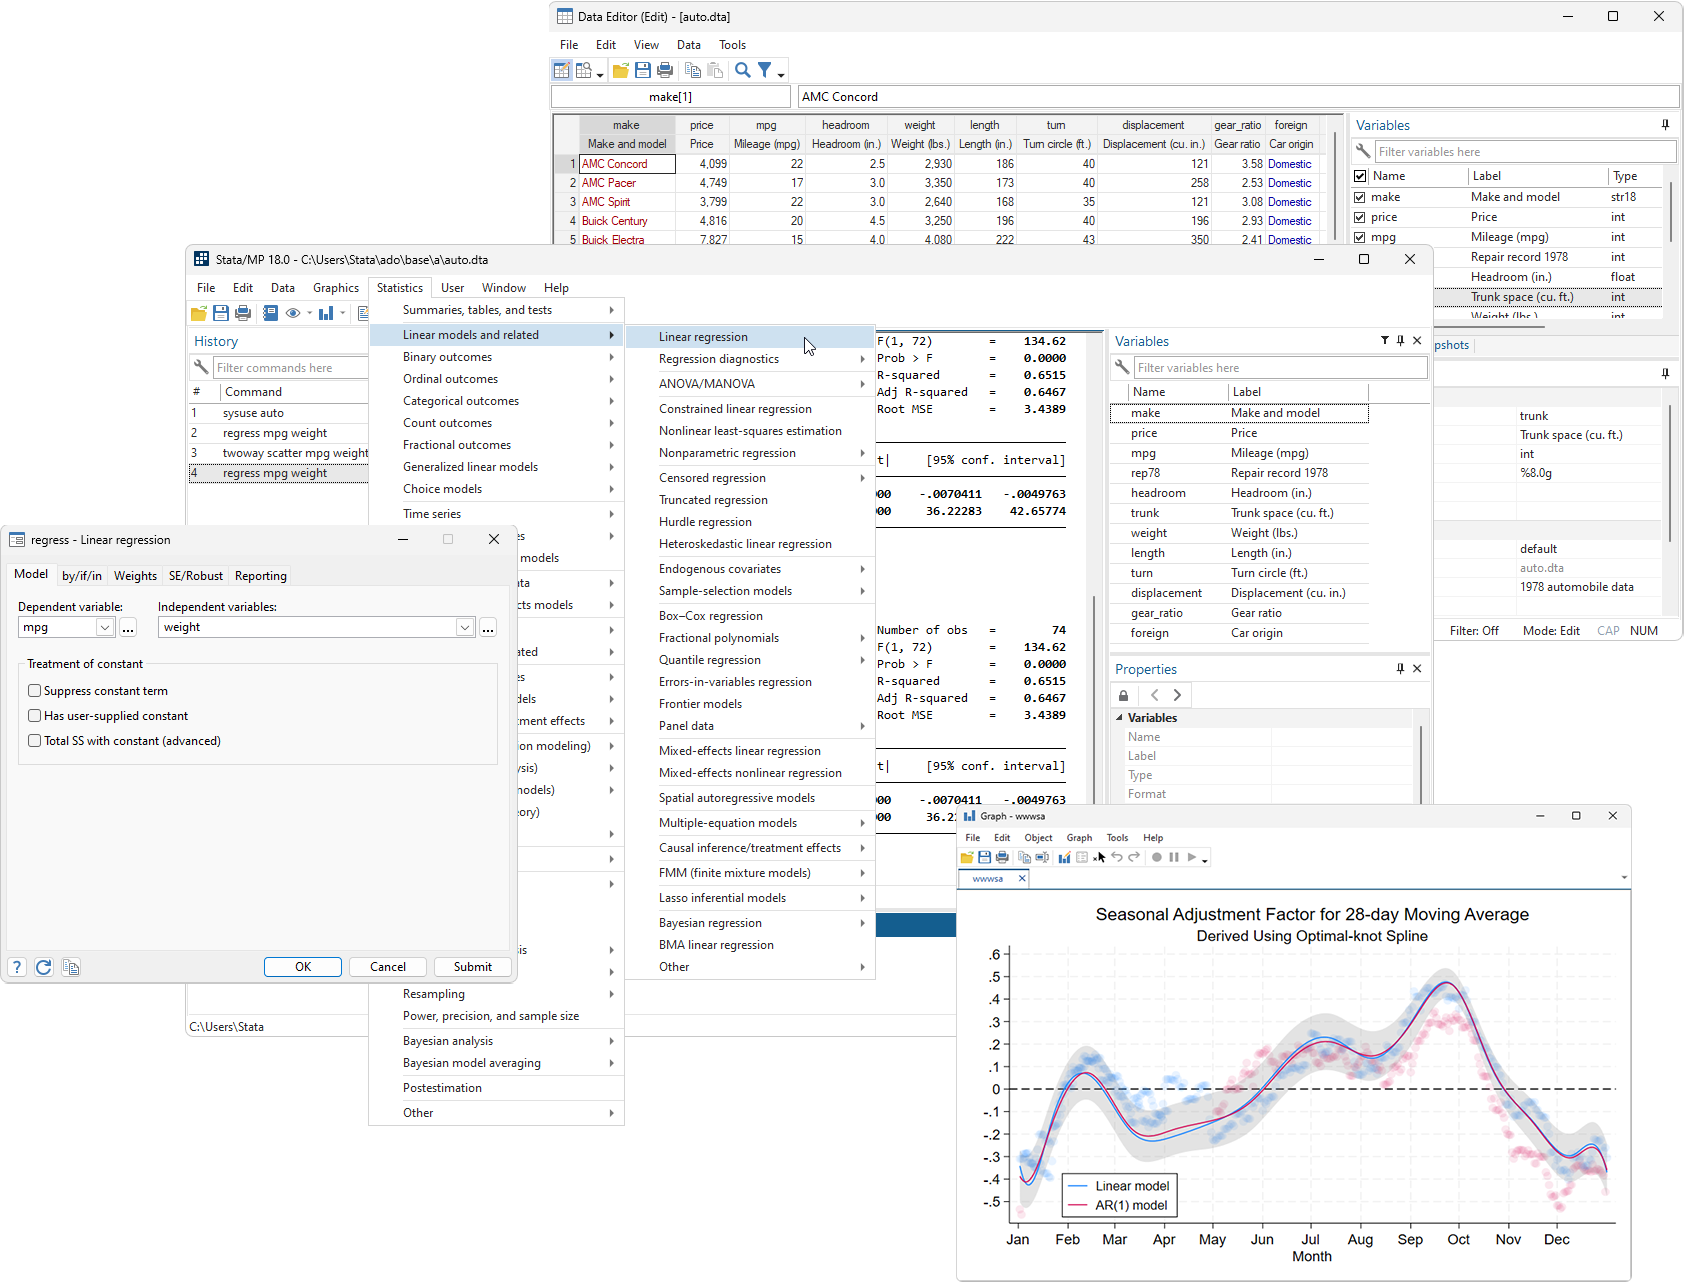
The Advantages Stata
Stata is a powerful and comprehensive software package that offers a wide range of tools for working with data. It includes features for data processing, visualization, and statistical analysis, as well as automated reporting capabilities. If you are looking for a way to gain a deeper understanding of your data, Stata might be just what you need.
- Frames - simultaneous management of multiple datasets.
- Import, export: JDBC, ODBC, SQL
- Sorting, matching, merging, adding, creating:
— Built-in spreadsheet
— Unicode
— Processing text or binary data
— Access to data either locally or on a network
— Collecting statistics by group
— BLOB objects - strings that contain entire documents
— Billions of observations
— Hundreds of thousands of variables
- Supported Data Types: survival data, panel data, multilevel data, survey data, discrete Choice data, multiple imputation data, categorical data, temporary data
And much more to help you meet all your data requirements.
Stata Features
Stata offers all the necessary tools for working with data and performing statistical analysis: data processing, research, visualization, the application of statistical techniques, report creation, and ensuring the reproducibility of results. Used by researchers for more than 35 years, Stata provides everything you need for data science—data manipulation, visualization, statistics, and automated reporting.
Areas of Application
— Behavioral Sciences
— Biostatistics
— Data Science
— Economics
— Education
— Epidemiology
— Finance, Business and Marketing
— Organization Research
— Medicine
— Political Science
— Healthcare
— Public Policy
— Sociology
Publication Schedule


— The Stata makes it easy to create professional-looking graphs with a customizable design.
— Create a custom chart using the mouse. Simply drag and drop elements onto a canvas to create a custom chart.
— Write scripts to generate hundreds or thousands of reproducible graphs.
— Export graphs in various formats, such as EPS, TIFF for publishing, PNG or SVG for web use, and PDF for viewing.
— With the built-in graph editor, you have full control over every aspect of your graph. Change colors, fonts, sizes, and more to make your graphs stand out. Add headings, notes, lines, and arrows to enhance the clarity of your data. Plus, you can even add text to annotate specific points or areas of interest.
Automated reporting
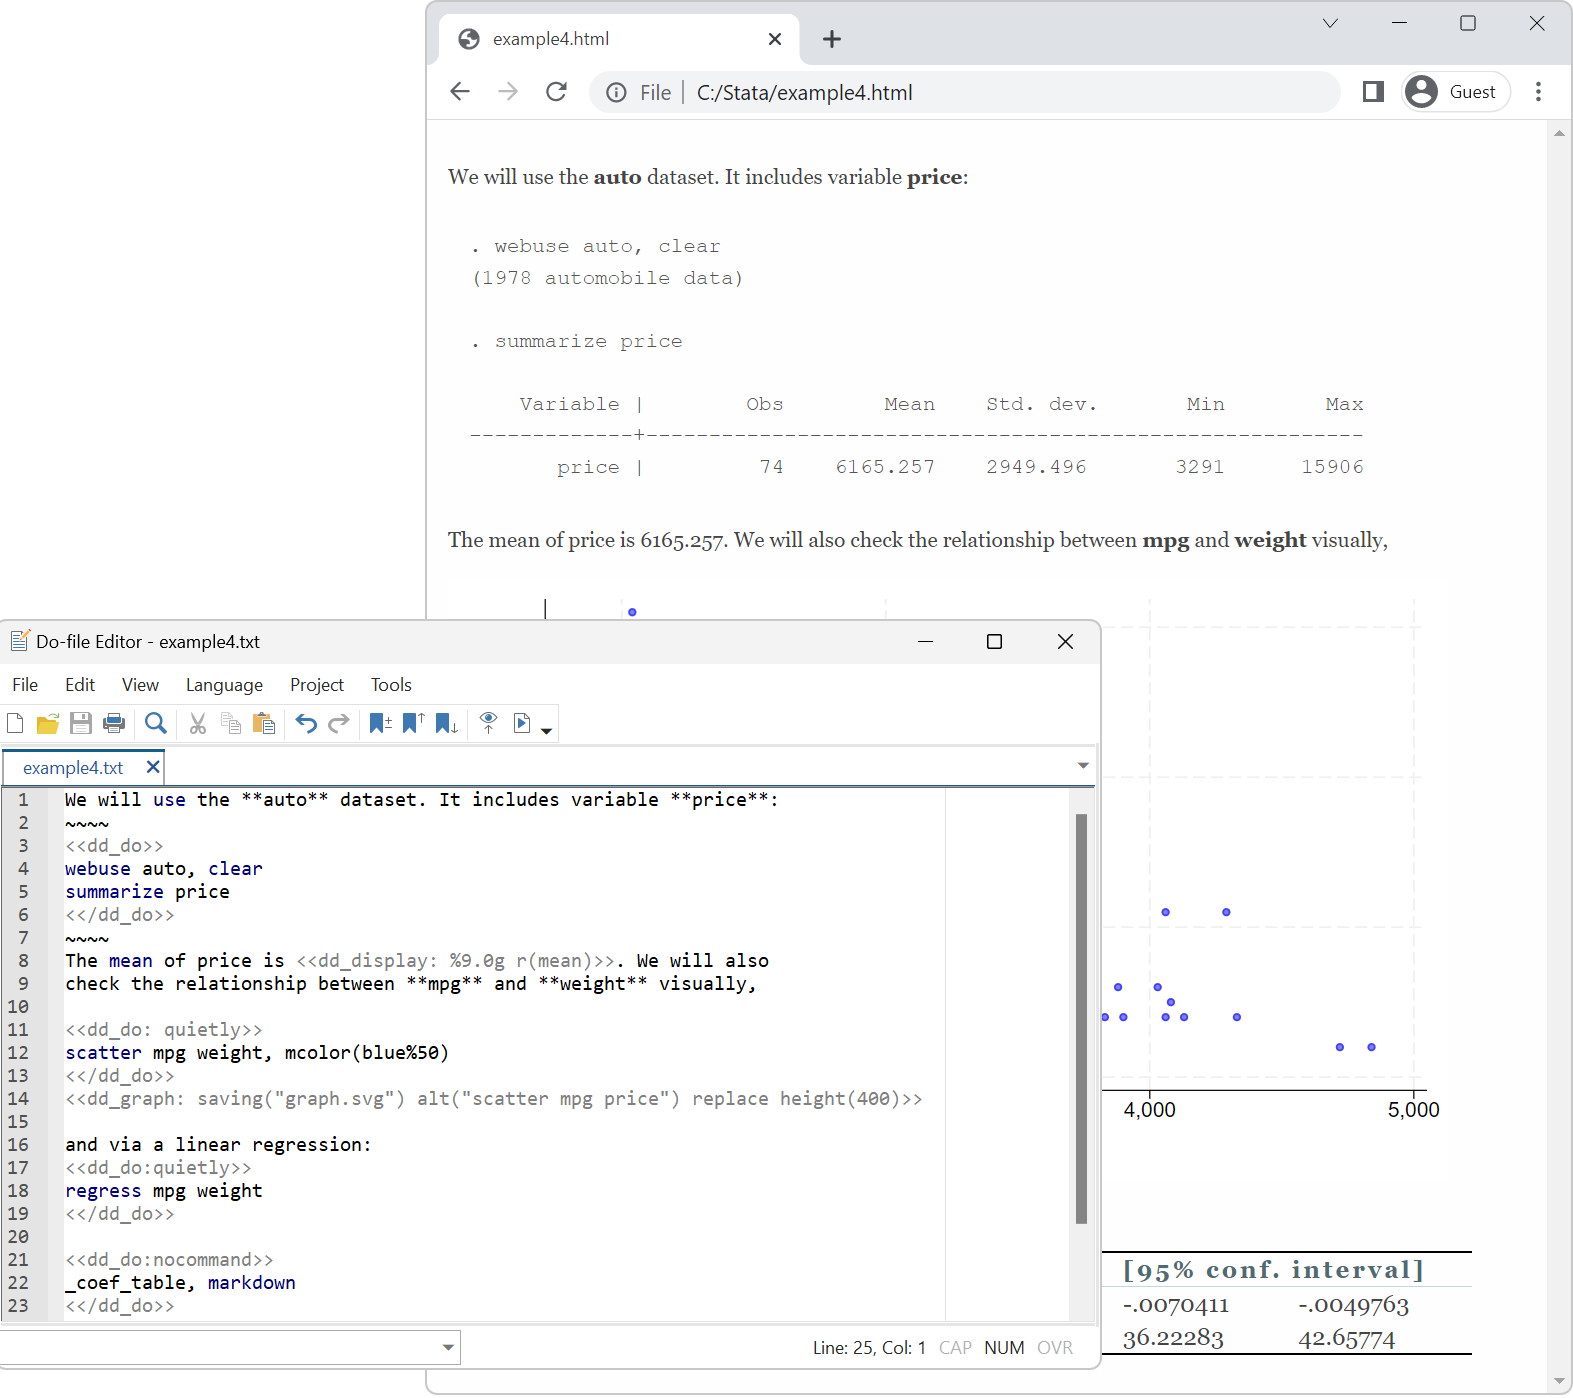
All the tools necessary to automate result reporting
— Dynamic Markdown documents: Create and edit documents quickly and easily with Markdown syntax.
— Creating Word documents
— PDF documents for sharing and printing
— Excel files for detailed data analysis
— Customizable tables for structured data presentation
— Diagrams for visualizing complex data relationships
— Output in various formats, including Word, HTML, PDF, Excel, SVG and PNG
Truly Reproducible Research
Stata is the only statistical software package that offers integrated version control. If you wrote a script to analyze data in 1985 using Stata, the same script would work and produce the same results today. Additionally, any dataset you created back then can still be accessed and read in the present, and the same will be true in the future as Stata will continue to be able to perform all the functions it does today.
Real documentation
Stata will not leave you stranded and will not require you to order additional books in order to understand all the details you need to know when analyzing or understanding the methods used.
Each data management function is thoroughly explained, documented, and demonstrated in practice using real-world examples. Every evaluator is thoroughly documented and includes multiple examples using real data, with detailed discussions on how to interpret the results. These examples provide you with data that you can use to work with Stata, and even expand on the analysis
Stata provides a "Quick Start" guide for each feature, showing some of the most common ways to use it.
If you want more details, the "Methods and Formulas" section provides detailed information about the calculations, and the "Links" section points you to even more resources.
Stata has a lot of documentation, with over 18,000 pages spread across 35 volumes. However, you don't need to read all of it. Stata can search by keywords, index, and even community-provided packages to help you find everything you need about your topic.
Trusted
The results you see from a Stata estimator rest on comparisons with other estimators, Monte Carlo simulations of consistency and coverage, and extensive testing by our statisticians. Every Stata we ship has passed a certification suite that includes 4.1 million lines of testing code that produces 5.8 million lines of output. Stata certifies every number and piece of text from those 5.8 million lines of output.
Continuously updated
Staying on the most up-to-date version of Stata is now easier than ever.
StataCorp continually develops new features to enhance Stata software, from the latest statistical methods to the best in reporting, data visualization, and the user interface. With StataNow™, you do not have to wait until the next major release to begin using new features. Stata will release new features as soon as they are ready so that you can take advantage of them right away.
Ease of use
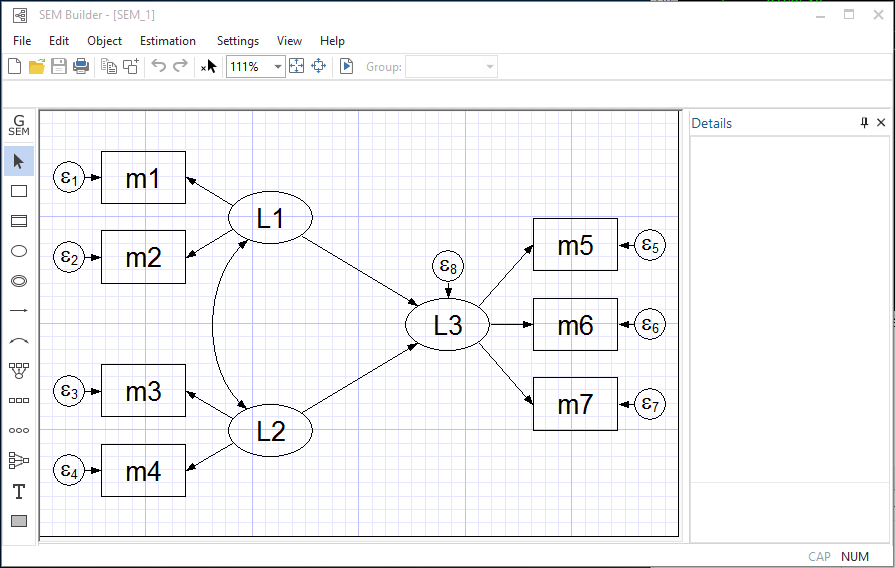
— The availability of all features. :
All Stata functions are available through menus, dialog boxes, control panels, a data editor, a variable manager, a graph editor, a table designer, and even a SEM diagram designer. You can perform any analysis simply by pointing and clicking with the mouse.
— Optional programming:
If you don't feel like writing commands and scripts, that's fine. You can still perform all the necessary actions through the interface, and then, if needed, save the relevant commands to reproduce the analysis later.
World-class technical support
Stata technical support is free to registered users of the current release (Stata 18).
Stata has a dedicated staff of expert Stata programmers and statisticians to answer your technical questions. From tricky data management solutions to getting your graph looking just right and from explaining a robust standard error to specifying your multilevel model, Stata has your answers.
Stata's Editorial Offices
- Stata/MP is the most powerful and fastest version of Stata, available for almost any modern computer. It takes advantage of multiprocessing, which makes it ideal for complex statistical analysis and large data sets. Stata/MP supports a wide range of multi-core processor architectures, making it the most versatile program for statistical analysis and data management.
- Stata/SE - is the universal version that effectively works with large volumes of data.
- Stata/BE - is the basic version. Suitable for working with moderate amounts of information
Why should one use Stata?
A wide range of statistical functions:
conduct in-depth data analysis. |
Publishing quality graphics:
сreate visually appealing reports. |
Automated reporting:
save time and effort in report preparation. |
Reproducible research:
ensure reliability and transparency of your results |
Integration with Python via PyStata:
expand Stata's capabilities with the help of a popular programming language. |
Detailed documentation:
access detailed information to work effectively with the software. |
Reliability:
trust Stata as a proven tool for working with data. |
Ease of use:
master Stata effortlessly. |
Scalability:
stata grows with your needs. |
Automation:
automate repetitive tasks to improve efficiency. |
Extensibility:
dditional features can be added using extensions. |
Advanced programming support:
solve complex problems using Stata's programming language. |
Automatic multicore processing:
take full advantage of your computer's power to speed up analysis. |
Community-developed functions:
get access to extra features built by Stata users. |
World-class technical support:
seek qualified assistance from the Stata support service. |
Cross-platform compatibility:
stata will operate on computers running Windows, Mac, and Linux/Unix operating systems. Stata licenses are platform-independent, meaning separate licenses are not required for a Mac laptop and a Windows desktop. You can install the same Stata license on any of the supported devices. |
Wide applicability:
join a large community of Stata users worldwide. |
Extensive resources:
find all the necessary information for learning and working with Stata. |
Active community:
receive support and advice from other Stata users. |
Affordable pricing:
enjoy all the benefits of Stata at a reasonable cost. |
|
Compatible operating systems
Although the program itself is dependent on the operating system, your Stata license will be valid on all supported platforms. Therefore, when purchasing a license, it is not necessary to specify the specific operating system.
Supported platforms:
Stata for Windows®
- Windows 11*
- Windows 10*
- Windows Server 2022, 2019, 2016, 2012R2*
Important: Stata requires a 64-bit version of Windows and an x86-64 x86-64 Intel® or AMD (Core i3 or higher).
Stata for Mac®
- Mac with Apple Silicon or Intel processor
- macOS 11.0 (Big Sur) or later for Mac computers with Apple Silicon, macOS 10.13 (High Sierra) or later for Mac computers with Intel
Stata for Linux
- Any 64-bit Linux distribution equivalent to Core i3 or higher
- The minimum requirements include a GNU C library version 2.17 or higher (glibc)
- For xstata to work, LIBCURL GTK 2.24 is required
Hardware requirements
| Package |
Memory
(RAM) |
Available space
(Storage) |
| Stata/MP |
4 GB |
2 GB |
| Stata/SE |
2 GB |
2 GB |
| Stata/BE |
1 GB |
2 GB |
For Stata on Linux, a graphics card capable of displaying thousands of colors or more (16-bit or 24-bit color) is required.

Stata 18 is the latest version of the software. Provides everything you need for deep data analysis.
— powerful statistical methods
— flexible visualization settings
— remote data processing
— automated preparation of reproducible reports
 |
 |
 |
|
Bayesian Model Averaging (BMA) commands
Don't know which predictors to use in your regression.
Consider using BAM. This approach can help account for uncertainty in your data and provide more accurate results. Additionally, exploring influential models and variables can help you identify the most significant predictors and improve the accuracy of your predictions, and much more.
|
Causal Mediation Analysis
(CMA)
CMA quantifies the strength of causal relationships between variables. The analysis of mediation reveals whether these relationships are influenced by another factor.
Are the effects of one variable mediated by another? Evaluate both direct and indirect effects, and calculate the proportion of indirect effects.
|
Heterogeneous DID
Evaluate the effects of treatment, varying by group and time. Select models for repeated cross-sections or panel data.
Visualize the effects. Aggregate effects within a group, time, or treatment exposure.
|
 |
 |
 |
|
Brand new style of graphs
— White background
— Horizontal y-axis labels
— Saturated color palette
— Legend on the side
— And much more
You can also colorize graphs by variables
|
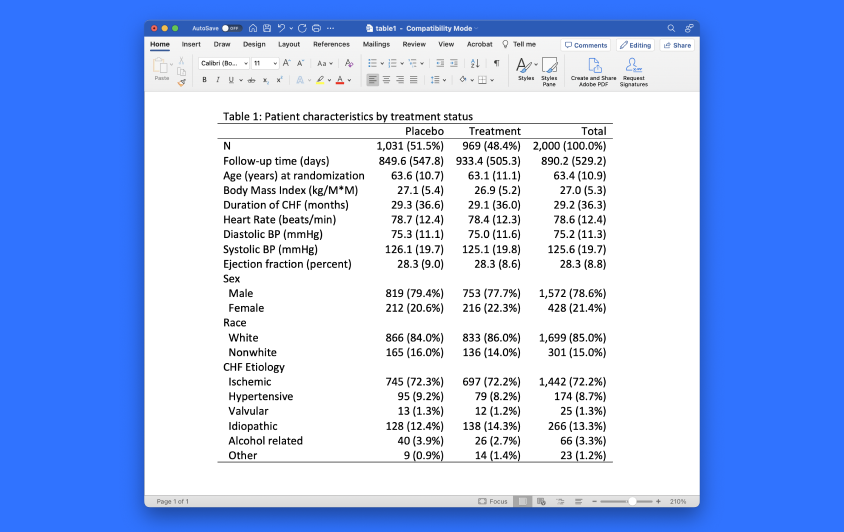
Table 1
Now you can create descriptive statistics tables more easily with the new 'dtable' command!
Export tables to Word, Excel, PDF, LaTeX, HTML, Markdown, and other formats.
|
Aliases of Variables in Frames
Use variables from multiple datasets as if they were all in one set
Now, you can also work with groups of frames.
|
 |
 |
 |
|
Group sequential design
Calculate the stopping limits for efficacy and futility for clinical trials. Determine the necessary sample size for intermediate and final analyses when testing proportions, means, or survival curves.
|
Multilevel meta-analysis
Do your studies involve size effects nested at multiple levels of grouping?
Utilize multilevel meta-analysis to account for potential dependencies between size effects when pooling results.
|
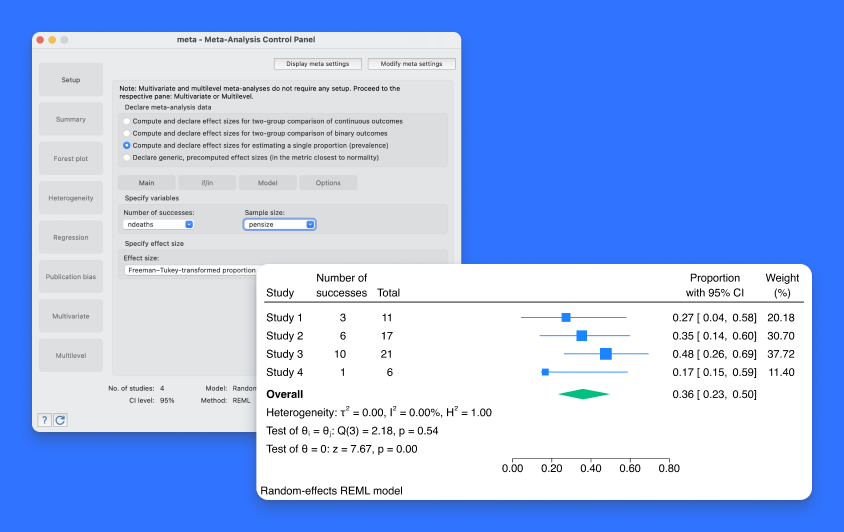
Meta-analysis of Prevalence
Perform a meta-analysis to determine the proportion or prevalence of a given phenomenon. Create forest plots to visualize the results. Explore heterogeneity between studies. Perform subgroup analyses to investigate potential sources of variation. And more!
|
 |
 |
 |
|
Reliable output for linear models
Reliable Stata functions for linear models have become even more reliable.
|
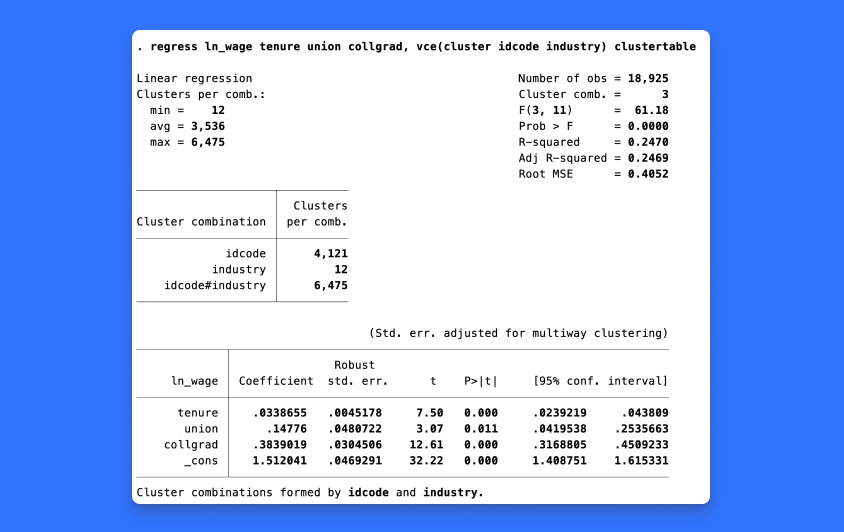
Bootstrap with Wild Clusters
Small number of clusters? Uneven number of observations per cluster? No problem!
Wild cluster bootstrapping handles them all.
|
RERI
How do interactions between factors increase risk? Find out using RERI.
|
 |
 |
 |
|
TVC with an interval-censored Cox model
Include time-varying covariates in your interval-censored Cox analysis, including prediction and graphs of survival functions and other functions.
|
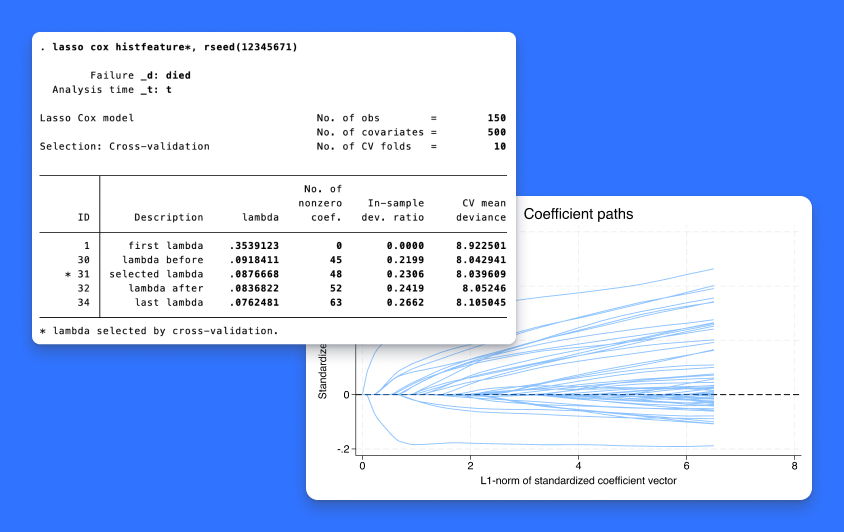
Lasso for the Cox model
Select variables in the Cox model using a lasso and an elastic mesh.
Calculate forecasts. Plot survival, failure, and other functions.
|
GOF graphs for survival models
Do you want to know how well your survival model matches your data?
The GOF graph simplifies this. Use it with right-censored and interval-censored data, parametric and semiparametric models, and more.
|
 |
 |
 |
|
Local Projections for Impulse Response Functions (IRF)
Local Projections for Impulse Response Functions.
Test hypotheses about multiple coefficients of IRFs. Plot IRFs, orthogonalized IRFs, and dynamic multipliers.
|
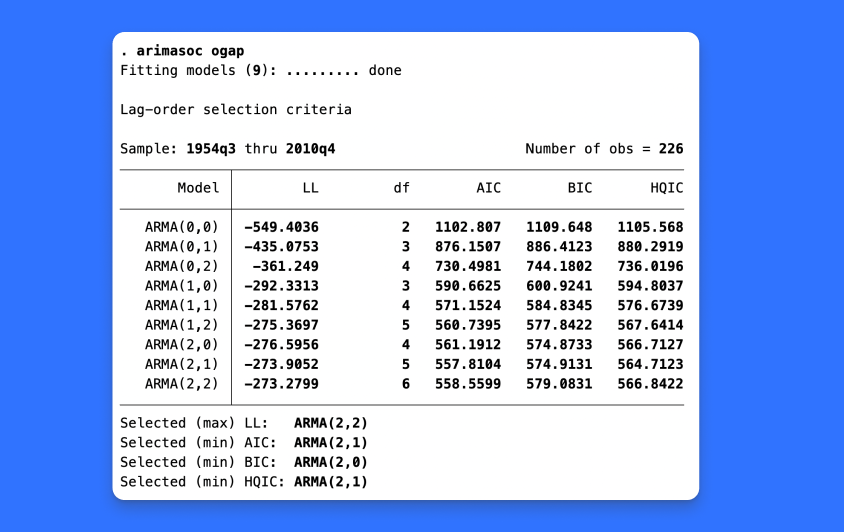
Model Selection for ARIMA and ARFIMA
Compare potential ARIMA or ARFIMA models using AIC, BIC, and HQIC.
Select the optimal number of autoregressive and moving average terms.
|
Flexible demand systems
— Evaluate the demand for a set of products.
— Assess the sensitivity to price and cost changes.
|
 |
 |
 |
|
Quantile Regression with Instrumental Variables
— Estimate the effect of covariates on quantiles of the conditional distribution of the outcome.
— Account for endogeneity.
— Plot coefficient graphs by quantiles.
|
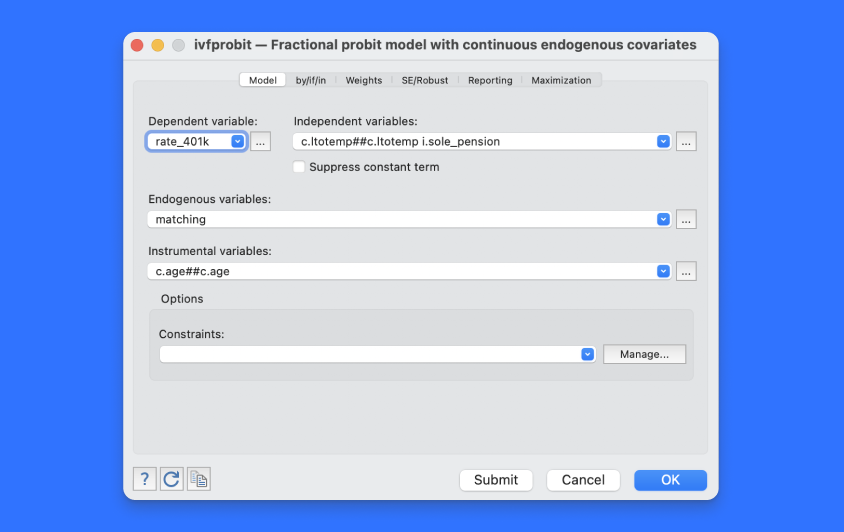
Instrumental-variables fractional probit model
— Are you modeling a share or a bid?
— Do you have any endogenous covariates that you would like to include in your model?
— You can use the ivfprobit package to customize your model.
|
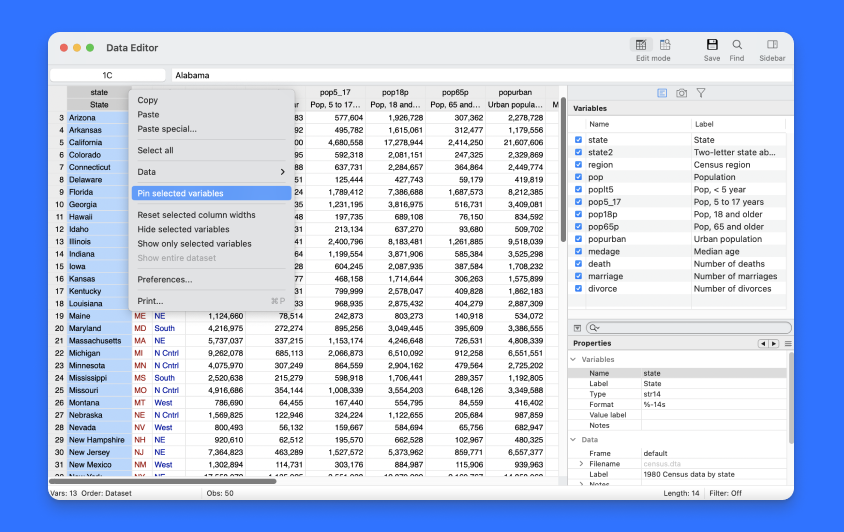
Interface improvements
— Data Editor: Lockable rows and columns, tooltips for truncated text, variable labels in headers, and more.
— Do-file Editor: Automatic backups and syntax highlighting for custom keywords.
|
The most powerful and fastest version of Stata.
Stata/MP allows you to analyze data in less time on low-cost multi-core laptops and desktops, as well as on multiprocessor servers.
- Use only 2 cores: your analysis will be performed two to three times faster compared to Stata/SE.
- Use 4 cores: reduce the time by two to four times.
- Use more cores: get even faster analysis. Stata/MP supports up to 64 cores/processors.
Speed is often crucial when performing resource-intensive assessment procedures. Some Stata estimation procedures, including linear regression, are almost perfectly parallelized. This means that they work twice as fast on 2 cores, four times faster on 4 cores, eight times faster on 8 cores, etc.
Some evaluation commands are parallelized better than others. On average, evaluation teams run 1.7 times faster on 2 cores, 2.6 times faster on 4 cores, and 3.4 times faster on 8 cores.
Speed is also an important consideration when working with large datasets. Adding new variables is almost 100% parallelized, while sorting is parallelized by 61%.
Some procedures in Stata are not parallelizable, and others are sequential by design, meaning their speed does not change when running in Stata/MP.
Speed is particularly important when dealing with large volumes of data. That's why Stata/MP can handle even larger datasets than Stata/SE, making it an ideal choice for those who need to work with extensive data sets.
- Stata/SE: it can analyze up to 2 billion observations
- Stata/MP: it can analyze from 10 to 20 billion observations on the most powerful modern computers and is ready to analyze up to 1 trillion observations when the computer equipment reaches the necessary level
Stata/MP also allows you to work with 120,000 variables, while Stata/SE allows only 32,767 variables
| |
Max. number of variables |
Max. number of independent variables |
Max. number of observations |
| Stata/MP |
120 000 |
65 532 |
20 billions* |
| Stata/SE |
32 767 |
10 998 |
2,14 billions |
| Stata/BE |
2 048 |
798 |
2,14 billions |
* The maximum number of observations is limited by the amount of available RAM on your system.


